Case study · 06
Australian Apparel Sales Analysis — Q4 2020
Overview
Exploratory data analysis of AAL (Australian Apparel Limited) Q4 2020 retail sales across seven states, four customer segments, and time-of-day patterns — turning 7,560 transaction records into an executive dashboard and strategic recommendations for Sales & Marketing.
Project preview
Technologies used
- Python
- Pandas
- NumPy
- Matplotlib
- Seaborn
- Jupyter Notebook
- scikit-learn
Key features
- Seven-phase EDA pipeline: data understanding, cleaning, univariate/bivariate/multivariate analysis, time series, and executive recommendations
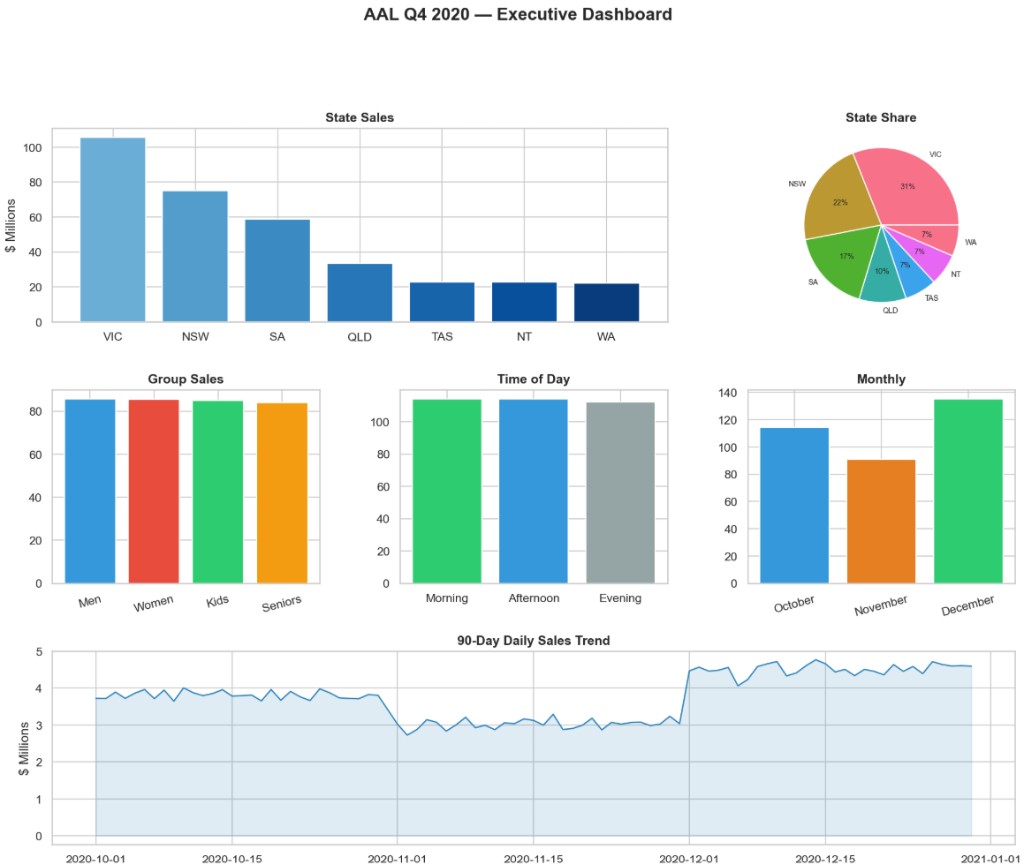
- Executive dashboard summarizing state rankings, demographic split, time-of-day patterns, monthly performance, and 90-day daily trend
- State performance analysis — VIC leads at 31% share ($105.6M); WA/NT/TAS flagged for targeted growth programs
- Multivariate heatmaps (state × group, time × state) revealing regional vs demographic drivers
- 20+ Matplotlib/Seaborn visualizations with documented KPI dictionary and zero missing values / duplicates
Challenges solved
- Translating right-skewed sales distributions (skewness 1.09) into executive-friendly metrics without oversimplifying
- Reconciling evenly split demographic revenue (~25% each group) with sharply uneven state performance (VIC 4.8× WA)
- Surfacing actionable staffing and promotion insights when time-of-day splits are nearly equal (~33% each period)
Architecture & engineering highlights
CSV ingest → Jupyter EDA notebook (7 phases) → statistical profiling and 13+ chart assets → executive dashboard and README-ready visual exports via generate_readme_assets.py.
Engineering highlights
$340.3M Q4 analyzed
136,121 units across 90 days (Oct–Dec 2020) at $2,500/unit fixed pricing — December drove 39.8% of quarter revenue (+49.2% vs November).
State-led growth levers
VIC generates $83.4M more than WA; recommendations target WA, NT, and TAS while protecting VIC, NSW, and SA leadership.
Operational insights
Morning peaks nationally but SA peaks Afternoon and NT Evening — staffing and evening NBO campaigns should vary by state, not one national schedule.
Screenshots
- Frame 02Wire `screenshots` in caseStudies.ts when captures are ready.
- Frame 03Wire `screenshots` in caseStudies.ts when captures are ready.
Future improvements
- Interactive Plotly/Streamlit dashboard for drill-down by state and segment
- November mid-Q4 promotional scenario modeling before December surge
- Scheduled data quality checks if pipeline moves beyond static CSV ingest